Test Observability: Metrics Beyond Red and Green
TestlandJune 4, 2026Test observability goes beyond pass/fail results. Track flake rates, test duration trends, and retry patterns to identify CI bottlenecks and build trust.
A red X in CI tells you something failed. It doesn't tell you whether it's the same test that failed last Tuesday, whether the suite is quietly getting slower, or whether your team has stopped trusting CI altogether. Test observability is the practice of measuring suite health from its outputs: CI logs, timing data, retry counts, and structured reports. The goal is to move from binary pass/fail toward a clear picture of how your suite is actually behaving over time. According to Katalon's analysis of flaky-test costs (citing Parry et al., 2022), 59% of developers encounter flaky tests at least monthly. This post covers six test observability metrics worth tracking, what Google, Microsoft, and Shopify built to make flakiness visible, and how to start without a dedicated platform.
Test observability defined: outputs that reveal internal state
The Ministry of Testing glossary defines observability as "the ability to understand a system's internal state by analyzing its external outputs." BetterStack sharpens the distinction between monitoring and observability: "Monitoring tells you if something is wrong. Observability helps you figure out why."
For a test suite, the system is the suite itself plus its environment plus the application under test. The outputs are CI logs, JUnit XML reports, retry logs, and timing data. Pass and fail are binary readings from those outputs. What matters is the distribution behind them: does a given test fail 1% of the time or 20%? Is it always the same test? Is failure clustering around one area of the app?
Martin Fowler's definition of a non-deterministic test is precise and worth quoting directly: "A test is non-deterministic when it passes sometimes and fails sometimes, without any noticeable change in the code, tests, or environment." Binary pass/fail gives you no way to distinguish a real regression from that pattern. Test observability does.
Why pass/fail alone erodes trust
The trust-erosion arc is predictable. A few flaky tests appear. Developers start ignoring CI red. Then they stop waiting for CI before merging. Then CI is effectively off.
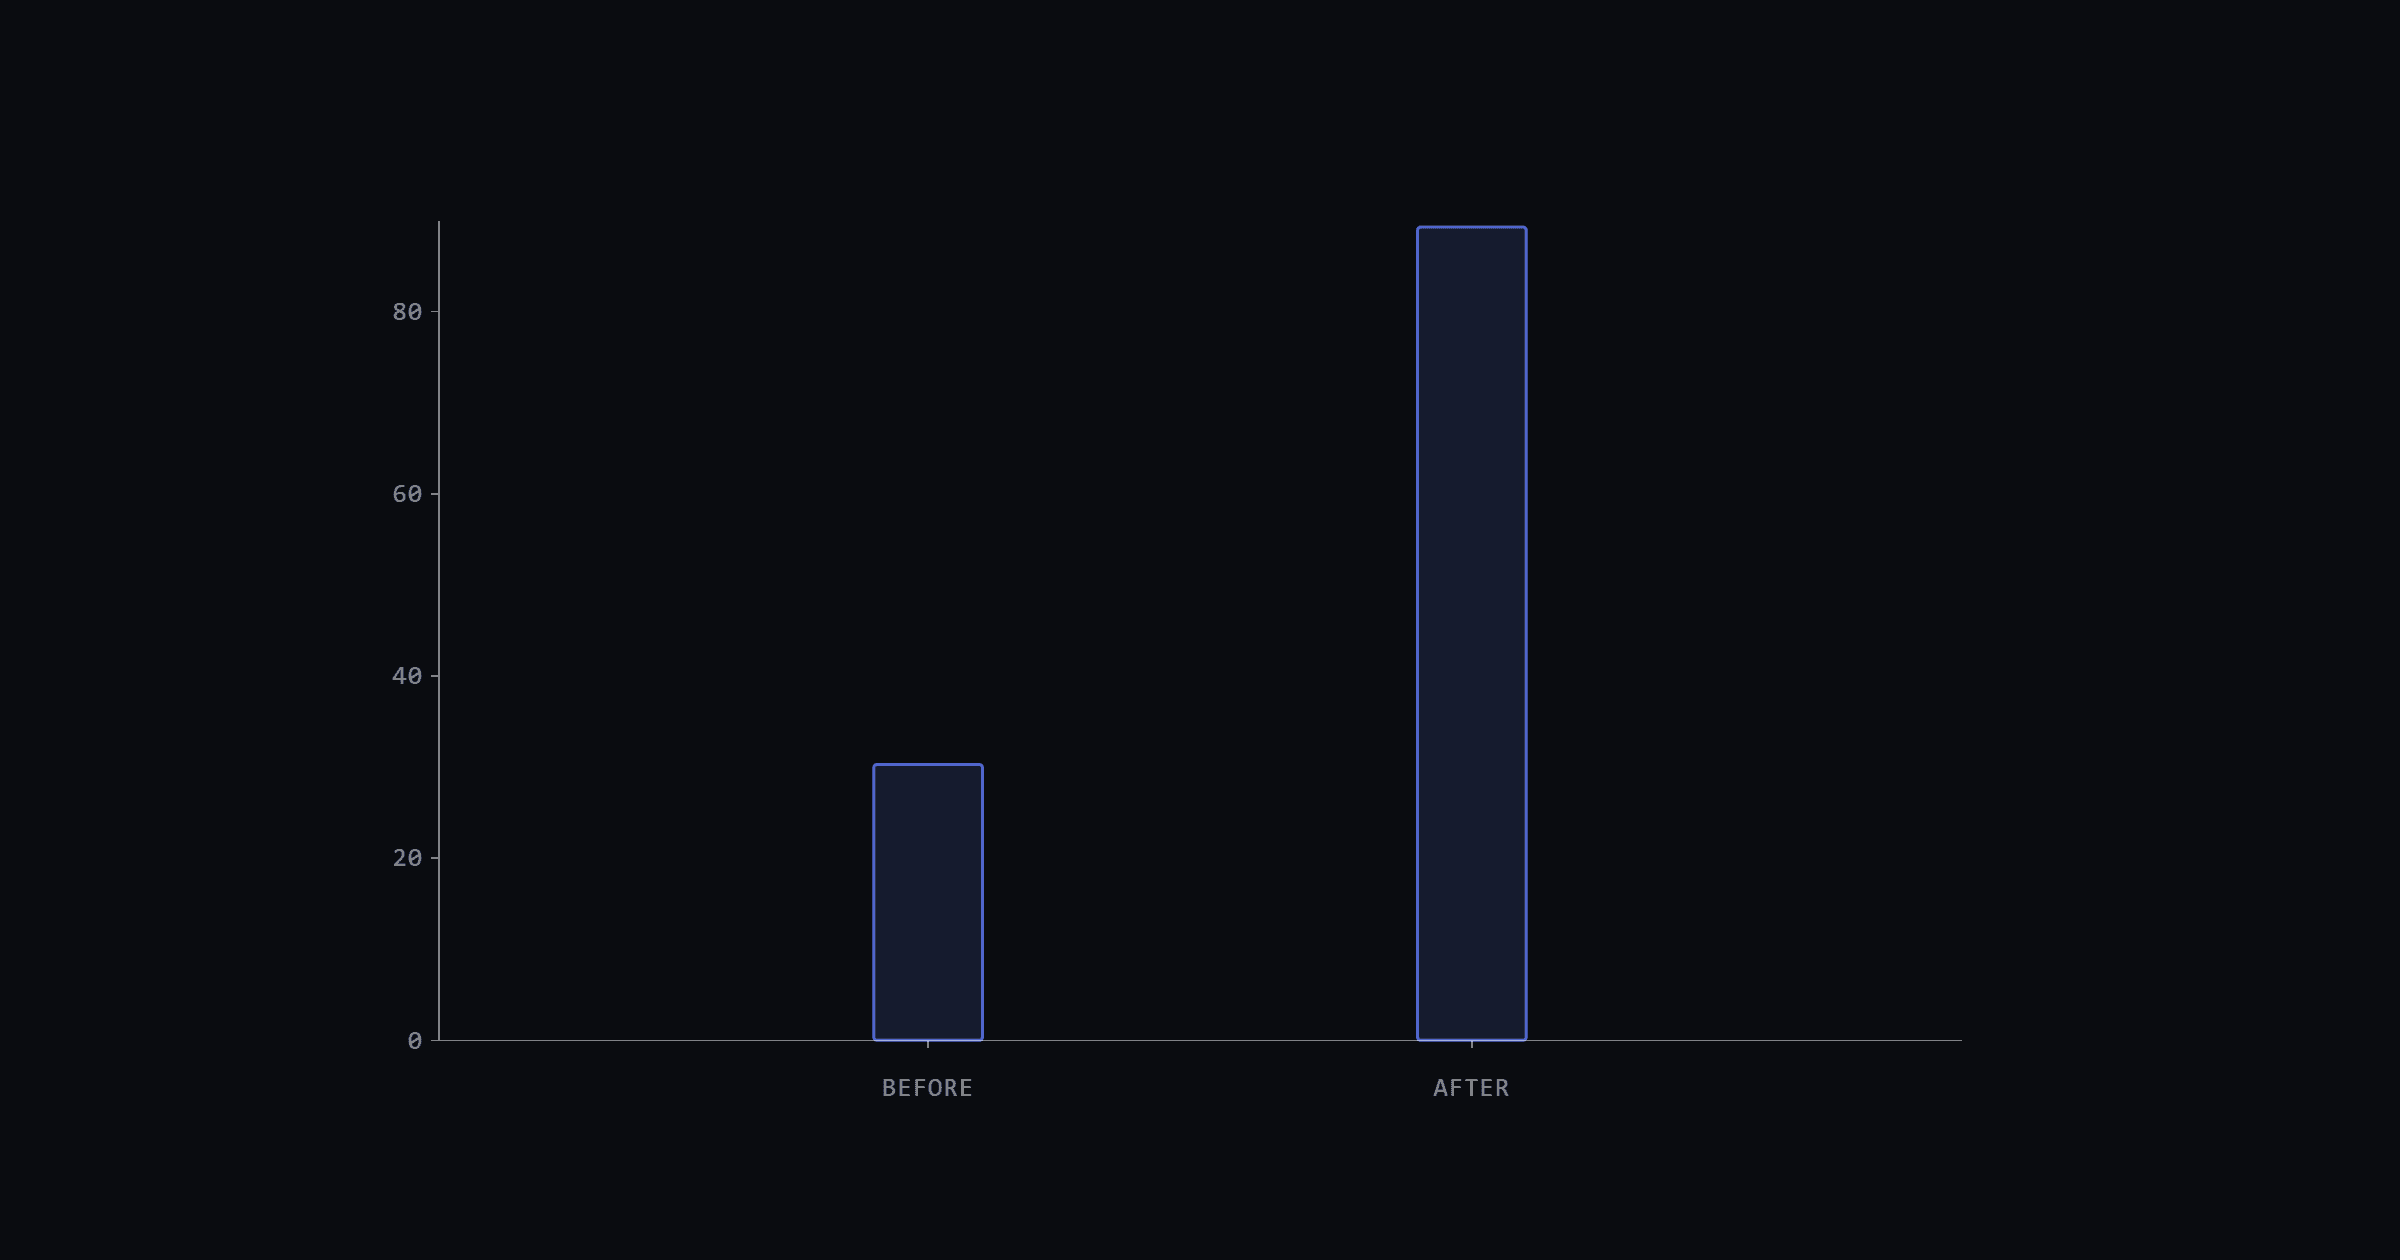
Shopify documented the mechanics precisely when describing their Android pipeline: "Developers lose trust in the test infrastructure when CI is red most of the time due to test flakiness or infrastructure issues. They'll start assuming that every failure is a false positive caused by flakiness." Shopify's Android pipeline pass rate was 31% before they intervened. After their retry and flakiness management work, it rose to almost 90%.
The problem with pure pass/fail is that it gives no early warning of that erosion. A suite at 90% is very different from a suite at 31%, but both read as "CI is red today." Without trend data, you can't see which direction you're heading until trust has already collapsed.
Flaky-test numbers from teams that measured
The teams that measured the actual cost made the problem concrete enough to act on:
2.5% of developer time is the number to anchor on. That's roughly half a day per developer per month. For a team of 10, that's five developer-days a month spent not shipping.
The six metrics a test suite should emit
Pass rate alone is a lagging indicator. These six test observability metrics give you signal earlier, from the data your CI pipeline already produces:
| Metric | What it measures | Warning sign |
|---|---|---|
| Flake rate | % of runs failing without a code change | Any single test above ~1% |
| Duration trend | p95 runtime over time | Sustained upward drift over weeks |
| Retry rate | % of runs needing at least 1 retry | Climbing month over month |
| Failure clustering | Do the same tests fail together? | Same 3-5 tests co-failing repeatedly |
| Skip count | Skipped or xfail tests accumulating | Grows week over week |
| Time-to-diagnosis | Minutes from CI red to root cause | Regularly over 30min |
Flake rate and retry rate measure the same underlying problem from two angles. Flake rate tells you which tests are non-deterministic. Retry rate tells you how much your pipeline depends on retries to stay green. A rising retry rate with no code change is a sign that flake rate is worsening even if CI is still passing.
Duration trend is easy to overlook because slow tests still pass. But a suite that grows from 8 to 20min over three months is a suite developers will eventually stop running locally. The p95 metric matters more than the mean: a few outlier tests can hide inside an average while visibly blocking every slow branch.
Failure clustering and skip count are structural signals. Co-failing tests often share a dependency, a shared state, or a timing assumption. Skipped tests accumulate when someone marks a test as skipped to unblock a build and never comes back. Both are forms of technical debt that pass/fail hides entirely.
How Google, Microsoft, and Shopify made flakiness visible
The pattern across all three companies is the same: they built test observability infrastructure before fixing anything. The fixes followed the visibility.
Google ran flakiness detection across millions of test runs. The result was that 1.5% of runs flagged as flaky was an aggregate across a massive corpus, which meant the absolute number of affected builds was large enough to justify dedicated tooling.
Microsoft's system is a shipped internal platform, not a prototype. It identified ~49K flaky tests and rescued 160,000 sessions that would have failed, deployed across 100+ product teams. The critical design choice was auto-classification: the system categorizes the type of flakiness, not just which tests are flaky. That distinction is what makes the data actionable.
Shopify's turnaround on their Android pipeline required knowing which tests flaked and under what conditions, not just adding blanket retries. Retries pushed the pass rate up, but the measurement told them which tests to actually fix. Without the measurement, retries are a band-aid; with it, they're a tool for buying time while the real work happens.
Starting without a dedicated platform
The data source for test observability already exists: your CI artifacts. A minimal stack requires a CI provider, a structured reporter, and a small aggregation script.
For Playwright, structured output is one reporter config change. Add this to your playwright.config.ts:
// Playwright 1.44+
import { defineConfig } from '@playwright/test';

export default defineConfig({
  reporter: [
    ['json', { outputFile: 'test-results/results.json' }],
    ['html']
  ],
  // rest of your config
});
For pytest, JUnit XML output is a single flag. Add this to your CI run step:
# pytest 8.x
pytest --junitxml=results/junit.xml tests/
(For organizing the suite that produces these reports, the pytest fixtures guide covers the setup side.)
Once those artifacts are in CI, a weekly flake report is just a script that reads the last N report files, counts per-test failure frequency against runs with no code changes, sorts by flake rate, and posts a summary to Slack or a shared spreadsheet. No vendor required. If you want to see how GitHub Actions stores and surfaces these artifacts, that's a natural next step.
OpenTelemetry is one to track here. The OpenTelemetry project describes itself as "a collection of APIs, SDKs, and tools. Use it to instrument, generate, collect, and export telemetry data (metrics, logs and traces)..." The same primitives are starting to be applied to test run telemetry, which could standardize how test results are structured and queried across tools. It's not a reason to wait on building something simpler now, but it points toward where structured test reporting is heading.
When a dashboard is overkill
For a small suite, test observability can be a spreadsheet updated monthly. The math: 200 tests running 3 times a day at a 1% flake rate produces roughly 6 flaky runs per day. That's a short weekly review, not a platform project.
The threshold for investing in tooling is when flake rate passes ~5%, when multiple teams share a pipeline and blame attribution gets complicated, or when developers are visibly routing around CI (the Shopify 31% scenario). The 2.5% dev-time figure from the Leinen study is the break-even signal: if flakiness is costing your team more time than the tooling would take to build and maintain, the tooling wins.
For a team of 10 with even moderate flakiness, that break-even arrives faster than most teams expect.
Frequently asked questions
Is flake rate the same as failure rate?
No. Failure rate is the percentage of test runs that fail for any reason, including real bugs. Flake rate is specifically the percentage of failures that occur without any code change in the application or tests. A test that reliably catches a bug has a high failure rate and a low flake rate. A test that randomly fails on CI has a high flake rate and may have nothing to do with real defects.
How many runs do you need before flake rate means anything?
About 50 runs per test is a reasonable floor. With fewer runs, a single spurious failure looks like a 10-20% flake rate when the true rate is near zero. At 50 runs, a test failing 3 times reads as ~6% and starts to point at a real pattern. For high-frequency tests running dozens of times per day, you can reach statistical confidence within a week.
Do retries fix flaky tests or hide them?
Retries recover the build; they don't fix the test. Done carefully, retries buy time while the underlying issue is investigated. Done carelessly, they mask the signal. If your retry rate is climbing month over month, the flake rate is also climbing: the retries are just preventing it from showing up as CI failures. For the systematic approach to actually resolving the root causes, see the guide on fixing flaky tests.
Does this apply to E2E suites?
Yes, more so. E2E tests run against real browsers, real network conditions, and real application state, which means they have more sources of non-determinism than unit or integration tests. The same reporter pattern works regardless of which framework you run (the Playwright vs Cypress vs Selenium comparison covers how each handles flakiness). E2E suites tend to have lower test counts but higher per-test flake rates, which makes the 50-run floor easier to hit but the per-test cost of flakiness higher.
Where test observability tooling is heading
Two directions stand out. First, OpenTelemetry-style structured telemetry for test runs is starting to standardize the schema for what a test result looks like as a machine-readable event, with timing, retries, environment context, and failure type all as queryable fields. Second, auto-classification of flake types is moving from internal Microsoft tooling toward something more accessible. Microsoft's system already categorizes flakes by type at scale; expect that capability to surface in CI platforms and open-source tools over the next few years.
The durable investment is structured reporting: JSON and JUnit XML outputs from your test runner. Any tooling layer built on top of those formats will remain compatible regardless of which vendor or platform wins.
What to read next: flaky-test fixes, CI artifacts, and pytest markers
When flake rate surfaces a problem in your suite, the next step is root-cause analysis: fixing flaky tests with a systematic approach covers the patterns that show up most often. For setting up the CI artifact pipeline that feeds flake-rate data, GitHub Actions for test automation is the right starting point. Before you have a measurement platform, pytest markers give you a way to tag slow and suspected-flaky tests manually, which makes it easier to spot patterns even in a spreadsheet.